Citations
Non conventional renewable energies to fullfill energy demands: analysis of 1990 to 2018 trends
Energías renovables no convencionales para satisfacer la demanda energética: análisis de tendencias entre 1990 y 2018
Open | Download
Issue
Section
Articles
How to Cite
Non conventional renewable energies to fullfill energy demands: analysis of 1990 to 2018 trends. (2021). Revista EIA, 18(36), 36016 pp. 1-21. https://doi.org/10.24050/reia.v18i36.1513
Dimensions


license

This work is licensed under a Creative Commons Attribution-NonCommercial-NoDerivatives 4.0 International License.
Copyright statement
The authors exclusively assign to the Universidad EIA, with the power to assign to third parties, all the exploitation rights that derive from the works that are accepted for publication in the Revista EIA, as well as in any product derived from it and, in in particular, those of reproduction, distribution, public communication (including interactive making available) and transformation (including adaptation, modification and, where appropriate, translation), for all types of exploitation (by way of example and not limitation : in paper, electronic, online, computer or audiovisual format, as well as in any other format, even for promotional or advertising purposes and / or for the production of derivative products), for a worldwide territorial scope and for the entire duration of the rights provided for in the current published text of the Intellectual Property Law. This assignment will be made by the authors without the right to any type of remuneration or compensation.
Consequently, the author may not publish or disseminate the works that are selected for publication in the Revista EIA, neither totally nor partially, nor authorize their publication to third parties, without the prior express authorization, requested and granted in writing, from the Univeridad EIA.
Show authors biography


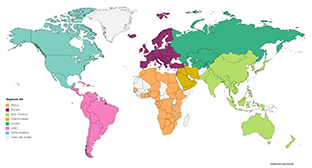
The purpose of this article is to analyse the progress after 3 decades of efforts to migrate to renewable energies, specifically non-conventional renewables. Data on final energy production and consumption were analyzed by regions, as defined by the International Energy Agency (IEA), and a timeframe between 1990 and 2018.
Although the production of renewables in the last three decades almost doubled, the share of different types of energy sources did not change substantially: the percentage of energy produced with fossil fuels in 2018 accounted for 81% of the total, just as in 1990. Total energy consumption from renewables went from 15,4% in 1990 to 15,9% in 2018. Non conventional renewables went from 0,1% to 1,9% in the same period of time.
In 2018, Iceland was the economy with the highest percentage of final energy consumption coming from non-conventional renewables, with roughy 42% from geothermal energy. Denmark ranked second, with 10% of the final demand supplied with non-conventional renewables.
It was found that smaller-scale economies allow higher participation of non conventional renewable energies, while renewables generated with biomass and hydropower have a greater scope for larger-scale energy matrices. However, environmental impacts related to conventional and non-conventional renewables must be considered, if the environmental cost of development is intended to be reduced.
Article visits 1549 | PDF visits 735
Downloads
Download data is not yet available.
- Banco Internacional para la Reconstrucción y el Desarrollo y Banco Mundial. (2020). Tracking SDG 7. The energy progress report 2020. [En línea]. Disponible en: https://trackingsdg7.esmap.org/downloads (Último acceso: 3 de marzo de 2021)
- Banco Mundial. (2020). Base de datos del Banco Mundial. Obtenido de Base de datos del Banco Mundial. [En línea]. Disponible en: https://datos.bancomundial.org (Último acceso: 3 de marzo de 2021)
- Comisión Económica para América Latina y el Caribe , CEPAL. (2014). Pactos para la igualdad: hacia un futuro sostenible. CEPAL: Lima.
- Dincer, I. (2000). Renewable energy and sustainable development: a crucial review. Science Direct, 4(2), pp. 157-175. https://doi.org/10.1016/S1364-0321(99)00011-8
- Espejo-Marín, C. y Aparicio-Guerrero, A.E. (2020). La Producción de Electricidad con Energía Solar Fotovoltaica en España en el S. XXI. Revista de Estudios Andaluces, 39, pp. 81-83. https://dx.doi.org/10.12795/rea.2020.i39.04
- Glantz, M. y Wolde-Georgis, T. (2010). Biofuels in Africa: A pathway to development. International Research Center for Energy and Economic Development, 43. http://ssrn.com/abstract=1589101
- Grupocobra. (2021). Complejo Fotovoltaico Escatron. [En línea]. Disponible en: https://www.grupocobra.com/proyecto/complejo-fotovoltaico-de-escatron/ (Último acceso 3 de marzo de 2021)
- Iberdrola. (2021). Planta Fotovoltaica Núñez Balboa. [En línea]. Disponible en: https://www.iberdrola.com/sala-comunicacion/noticias/detalle/nunez-balboa-operativa-iberdrola-pone-marcha-mayor-planta-fotovoltaica-europa (Último acceso 3 de marzo de 2021)
- Iberdrola. (2021a). Planta Fotovoltaica de Francisco Pizarro. [En línea]. Disponible en: https://www.iberdrola.com/conocenos/lineas-negocio/proyectos-emblematicos/planta-fotovoltaica-francisco-pizarro (Último acceso: 3 de marzo de 2021)
- International Energy Agency, IEA. (2020). IEA Countries and regions. [En línea]. Disponible en: https://www.iea.org/countries (Último acceso: 3 de marzo de 2021)
- IEA. (2020a). Data and statistics. Data tables. Year: 2018. [En línea]. Disponible en: https://www.iea.org/world (Último acceso: 3 de marzo de 2021)
- IEA, OCDE y EUROSTAT. (2005). Energy Statistics Manual. pp. 6. [En línea]. Disponible en: https://www.iea.org/reports/energy-statistics-manual (Último acceso: 3 de marzo de 2021)
- International Renewable Energy Agency, IRENA. (2017). Synergies between renewable energy and energy efficiency, a working paper based on Remap. International Renewable Energy Agency (IRENA). Abu Dhabi. pp- 11
- Kumar, A., T. Schei, A. Ahenkorah, R. Caceres Rodriguez, J.-M. Devernay, M. Freitas, D. Hall, A. Killingtveit, Z. Liu, 2011: Hydropower. In IPCC Special Report on Renewable Energy Sources and Climate Change Mitigation. Chapter 5. Hydropower [O. Edenhofer, R. Pichs-Madruga, Y.
- Sokona, K. Seyboth, P. Matschoss, S. Kadner, T. Zwickel, P. Eickemeier, G. Hansen, S. Schlömer, C. von Stechow (eds)], Cambridge University Press, Cambridge, United Kingdom and New York, NY, USA. pp 562 a 468
- MapChart.net (2021). Herramienta para la creación de mapas temáticos. [En línea]. Disponible en: https://mapchart.net (Último acceso: 11 de marzo de 2021)
- Ministerio para la Transición Ecológica y el Reto Demográfico. (2020). Informe estadístico de energías renovables. Potencia eléctrica acumulada a 2018 (kW). [En línea]. Disponible en: http://informeestadistico.idae.es/t6.htm (Último acceso: 3 de marzo de 2021)
- Ministerio para la Transición Ecológica y el Reto Demográfico. (2020a). Plan Nacional Integrado de Energía y Clima (PNIEC) 2021-2030. [En línea]. Disponible en: https://www.miteco.gob.es/images/es/pnieccompleto_tcm30-508410.pdf (Último acceso: 3 de marzo de 2021)
- Montecinos, S., y Carvajal, D. (2018). Energías renovables: escenario actual y perspectivas futuras. La Serena, Chile: Editorial Universidad de la Serena. pp. 13, 14.
- Moomaw, W.; Yamba, F.; Kamimoto, M.; Maurice, L.; Nyboer, J.; Urama, K. T. Weir, T. (2011). Introduction. In IPCC Special Report on Renewable Energy Sources and Climate Change Mitigation. Chapter 1. Renewable Energy and Climate Change. O. Edenhofer, R. Pichs-Madruga, Y. Sokona, K. Seyboth, P. Matschoss, S. Kadner, T. Zwickel, P. Eickemeier, G. Hansen, S. Schlömer, C.von Stechow editores. Cambridge University Press, Cambridge, United Kingdom and New York, NY, USA. pp. 164, 170
- Organización Mundial de la Salud, OMS. (1991). Consejo Ejecutivo, 89ª reunión, Ginebra, 4 de diciembre de 1991. Comisión de salud y medio ambiente de la OMS. Informe del director general. EB89/23. OMS. Pp. 5-6.
- Organización para la Cooperación y el Desarrollo Económicos, OCDE. (2020). OECD data. Primary Energy Supply. [En línea]. Disponible en: https://data.oecd.org/energy/primary-energy-supply.htm (último acceso: 3 de marzo de 2021)
- Programa de las Naciones Unidas para el Desarrollo, PNUD. (2015). Objetivos de Desarrollo Sostenible. Objetivo 7: Energía asequible y no contaminante. [En línea]. Disponible en: https://www.undp.org/content/undp/es/home/sustainable-development-goals/goal-7-affordable-and-clean-energy.html
- Serrano, M.; Margalida, A.; Pérez-García J.M.; Juste, J; Traba, J.; Valera, F.; Carrete, M; Aihartza, J.; Real, J.; Mañosa, S.; Flaquer, C.; Garin, I.; Morales, M.B.; Alcalde, J.T.; Arroyo, B.; Sánchez-Zapata J.A.; Blanco, G.; Negro, J.J.; Tella J.L.; Ibañez, J.; Tellería, J.L.; Hiraldo, F.; Donázar, J.A. (2020). Renewables in Spain threaten biodiversity. Science, 370(6522), pp. 1282-1283. Doi: 10.1126/science.abf6509
- Tremblay, A.; Varfalvy, L.; Roehm, Ch.; Garneau, M. (2004). The issue of greenhouse gases from hydroelectric reservoirs: from boreal to tropical regions. Hydro-Québec Prod. Environ. 1.
- World Bank, WB; International Finance Corporation, IFC; Multilateral Investment Guarantee Agencya, MIGA. (2016). World Bank Group Climate Change Action Plan 2016–2020. World Bank, Washington DC. License: Creative Commons Attribution CC BY 3.0 IGO. pp. 33.
- World Wildlife Fund, WWF. (2017). Las energías renovables: motor del desarrollo sostenible. [En línea] [consultado el 21 de julio de 2020]. Disponible en: https://www.wwf.org.co/?298831/Propuesta-energias-renovables-2030
- Yang, L; Lu, F.; Zhou, X; Wang, X; duan, X; Sun, B. (2014). Progress in the studies on the greenhouse gas emissions from reservoirs Acta Ecológica Sinica. 34(4) pp. 204-212. Doi: https://doi.org/10.1016/j.chnaes.2013.05.011